
Ultimate Guide to Salary Structure Design
If you don’t set pay rules early, pay gaps, hiring problems, and compliance issues show up fast. In this guide, I’d boil salary structure design down to a few core moves: pick a pay model, set a market pay target, level jobs the same way, build ranges with clear minimums and maximums, and document how pay changes happen.
Here’s the short version:
- I use pay grades, bands, or broad bands based on company size and how fixed jobs are
- I set pay around a market target like the 50th percentile
- I group jobs by level, scope, and impact before pricing them
- I build salary ranges with a minimum, midpoint, and maximum
- I track placement with compa-ratio and range penetration
- I write rules for merit pay, promotions, market shifts, and equity fixes
- I check FLSA status, overtime setup, and pay range posting rules
- I review ranges every year and do a deeper market check every 3 to 5 years
A few numbers stand out:
- Many employers target the 50th percentile
- Merit budgets often land around 3% of base payroll
- Promotion increases often fall around 8% to 15%+
- Unexplained pay gaps above 5% should get a close review
- Exempt pay under federal FLSA often starts with the $684/week ($35,568/year) salary threshold test
Designing Pay Structure, How to Calculate Salary Range Excel
sbb-itb-b1c1928
Quick comparison
| Topic | What matters most |
|---|---|
| Pay model | Grades for more control, bands for balance, broad bands for fewer limits |
| Range design | Midpoint tied to market data, spread tied to job level |
| Employee placement | Compa-ratio shows pay vs. midpoint; range penetration shows room left in band |
| Pay change rules | Written rules for merit, promotion, and market updates |
| Compliance | FLSA classification, overtime setup, and state/local pay posting rules |
| Upkeep | Annual review plus off-cycle updates after big business changes |
In other words: salary structure design is how I turn pay from case-by-case decisions into a repeatable system that managers, HR, and payroll can use without guessing.
Choose the Right Salary Structure Model
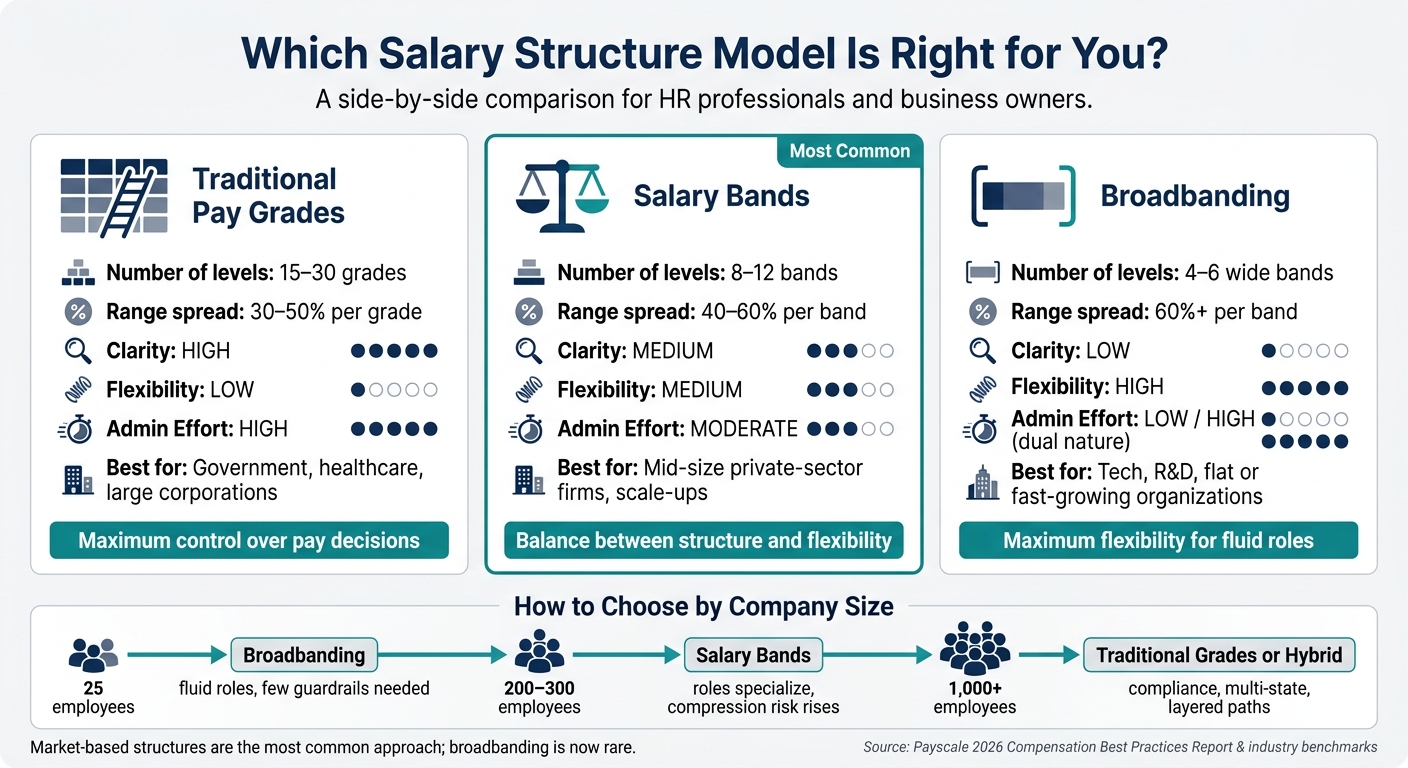
Salary Structure Models Compared: Grades vs. Bands vs. Broadbanding
Once a business knows it needs more structure, the next move is picking the model that fits its size and how fast things are changing. The right setup usually comes down to four things: company size, role stability, manager freedom, and growth speed.
Traditional grades, salary bands, and broadbanding
Traditional pay grades split jobs into many narrow levels. Each level has a set minimum, midpoint, and maximum salary. A mid-size U.S. employer might use 15–30 grades, with each range spanning about 30–50% from minimum to maximum. This gives HR close control and makes career paths easy to explain. The tradeoff is simple: once someone hits the top of the range, pay growth often means a promotion.
Salary bands group several grades into fewer, wider ranges. Most companies using this model have around 8–12 bands, with spreads of roughly 40–60%. That gives managers more room to reward skill growth and strong performance without changing the job title every time duties shift.
Broadbanding goes even further by compressing most grades into just 4–6 wide bands. This can work well for fast-moving companies where roles change often. But there’s a catch. It needs strong guardrails so pay decisions stay consistent and can hold up if challenged.
| Model | Clarity | Flexibility | Admin Effort | Typical Use Case |
|---|---|---|---|---|
| Traditional grades | High | Low | High | Government, healthcare, large corporations |
| Salary bands | Medium | Medium | Moderate | Mid-size private-sector firms, scale-ups |
| Broadbanding | Low | High | Low / High | Tech, R&D, flat or fast-growing organizations |
Market-based structures are the most common approach, while broadbanding is now rare.
Use the table as a quick filter. Then compare each option against your current headcount and growth stage.
How to pick a model based on company size and growth stage
The best model tends to shift as jobs get more stable, more specialized, and more regulated.
For a 25-person startup, a few broad bands or a broadband-style setup usually makes the most sense. Small teams with fluid roles need room to move more than they need a detailed ladder.
At around 200–300 employees, things start to change. Roles become more specialized, and managers usually need clearer pay guardrails. Salary bands with defined job levels often strike a good balance here. This is also the point where pay compression and internal equity issues can show up fast if there’s no written system behind pay decisions.
At 1,000+ employees across multiple states, complexity starts to pile up. Compliance, geographic pay differences, and layered career paths often push companies toward traditional grades or a hybrid model. For example, a company may use grades for corporate and operations roles, while keeping broader bands for tech or innovation teams. Geographic differentials can then be built into the ranges. At this stage, documentation matters a lot because it supports audits and helps teams make pay decisions the same way across locations.
A business has likely outgrown its current model when managers keep asking for exceptions, new hires come in above long-tenured employees in the same role, or HR can’t clearly explain why promotion pay changes look the way they do. When those patterns start showing up, it’s time to revisit the design during a regular review or after a major growth milestone.
After you choose a model, the next step is turning it into pay philosophy, job levels, and range rules.
Build the Foundation with Compensation Philosophy and Job Evaluation
Once you’ve picked a pay model, the next move is setting the rules that make it work. The model gives you the frame. Your compensation philosophy and job evaluation method tell you how pay decisions will actually be made. Before building salary ranges, define these two inputs first. Together, they make pay decisions more repeatable and easier to defend.
Set pay philosophy and market position
A compensation philosophy is a written statement that explains how your organization wants to pay people compared with the market. It should spell out your business and talent goals, market position, internal equity rules, the mix of base pay, variable pay, and benefits, plus any location or remote-work pay practices.
Lead, match, and lag usually line up with market percentiles:
- Lead: about the 75th percentile
- Match: about the 50th percentile
- Lag: about the 25th to 40th percentiles
Use lead for hard-to-fill roles, match for most jobs, and lag only when lower base pay is balanced by non-cash rewards. In Payscale's 2026 Compensation Best Practices Report, 45% of U.S. organizations target the 50th percentile.
Whatever path you take, write it down. The philosophy should be approved by leadership and backed by manager guidance and employee-facing talking points. That way, pay decisions are explained the same way across the company.
After market position, location policy becomes a big issue, especially for remote and multi-state teams. If your workforce is spread out, decide whether to use national pay ranges, location-adjusted ranges, or a tiered location model for higher-, mid-, and lower-cost U.S. markets. Geographic pay should be based on cost-of-labor data, and the policy should be reviewed on a regular basis.
Evaluate jobs and create job levels
Job architecture groups roles into families, sub-families, career streams, and levels. Compensation structure then puts pay around those jobs. Start with job analysis. Collect standardized data on responsibilities, skills, competencies, education, experience, decision authority, and problem-solving complexity.
From there, group similar roles into job families and define levels with clear criteria such as scope, business impact, complexity, and whether the role leads people or projects. When levels are well defined, managers have a much easier time applying the structure the same way.
Once roles are leveled in a consistent way, you can assign pay ranges with fewer exceptions. The next step is choosing how to evaluate those jobs. Four common methods are used, and each fits a different mix of company size and data access:
| Method | Rigor | Data Needs | Scalability | Best Fit |
|---|---|---|---|---|
| Ranking | Low | Minimal | Limited | Small businesses, early-stage startups |
| Classification | Moderate | Modest | Reasonable | Small to mid-sized employers, public sector |
| Point-factor | High | Substantial | High | Mid-sized to large organizations |
| Market pricing | Varies | High | High | Mid-sized and large U.S. employers |
In practice, many U.S. organizations use a hybrid approach. They use an internal evaluation method, such as point-factor or classification, to set job value, then use market pricing to line those jobs up with pay data from the market. If you rely on market pricing alone, you can run into gaps when a role doesn’t have a clean survey match. That’s why an internal evaluation method still matters.
Whatever method you choose, test it first in one or two major job families, adjust the criteria based on manager feedback, and document every evaluation decision. That record becomes the link to pay grades, salary bands, and later equity reviews.
With job levels defined, you can now set grades, bands, and movement rules.
Create Pay Grades, Salary Bands, and Pay Movement Rules
Set grades, midpoints, and range widths
Start by grouping similar roles into grades. The idea is simple: jobs with similar internal value, scope, and market pay should sit in the same grade. So if a Customer Support Representative I, Customer Support Representative II, and Administrative Assistant all benchmark around $45,000–$50,000, they may fit into Grade 5. Use the market target from your compensation philosophy to set each grade midpoint.
Next, assign a midpoint to every grade. This is the target pay for someone who fully performs in the role. If market data puts a Software Engineer II at the 50th percentile of $100,000, then $100,000 is your midpoint.
From there, set the range spread. For a midpoint of $100,000, a 40% spread creates a band from $80,000 to $120,000. That means 20% below and 20% above the midpoint. For hourly jobs, convert the rate to annual pay when needed. A role paid $20/hour works out to about $41,600 per year based on a 2,080-hour work year.
Typical U.S. range spreads by level look like this:
| Job Level | Typical Range Spread | Example Band |
|---|---|---|
| Entry-level / hourly / administrative | 30%–40% | $38,000–$52,000 (mid: $45,000) |
| Professional / mid-level individual contributor | 40%–50% | $80,000–$120,000 (mid: $100,000) |
| Senior professional / specialist / manager | 50%–60% | $97,500–$162,500 (mid: $130,000) |
| Director / executive | 60%–80%+ | $140,000–$260,000 (mid: $200,000) |
Bands should overlap on purpose, usually by 15%–25%. That gives employees room to get solid pay increases without needing a grade change every single time. But there is a line. If overlap gets above about 65%–70% of the lower band, your grades may be too close together or your spreads may be too wide. This is common in practice: one analysis found that about 97.6% of companies have overlap in at least one role.
| Band Design | Typical Spread / Overlap | Effect on Progression | Impact on Pay Compression | Admin Complexity |
|---|---|---|---|---|
| Narrow band | 20%–30% spread | Employees hit maximum quickly; promotions needed sooner | Lower within-band, higher across bands | Lower |
| Wide band | 40%–60% spread | More room for in-role growth and performance differentiation | Higher if not governed carefully | Higher |
| Low overlap | 0%–5% between bands | Clear career steps; larger pay jumps on promotion | Lower between levels | Lower |
| High overlap | 25%–40%+ between bands | Flexible hiring and promotion without forced increases | Higher if junior roles approach senior pay | Higher |
The goal is enough overlap to support growth without muddying the difference between levels. Once set, these bands become the base for hiring, pay placement, raises, and promotions.
Place employees in range using compa-ratio and range penetration
After the bands are built, you need a clean way to see where each employee sits inside them. Two metrics do that: compa-ratio and range penetration.
Compa-ratio compares an employee's pay to the midpoint of the range. If someone earns $90,000 in a band with a $100,000 midpoint, their compa-ratio is 0.90, or 90%. In many cases:
- Below about 0.85 can point to someone who is under market or still new in the role
- 0.85–1.15 is often treated as in range
- Above 1.15 can point to over-market pay or long-tenured employees whose pay has moved ahead of the band
Range penetration shows how far the employee has moved between the minimum and maximum of the band. The formula is: (Employee pay − Range minimum) ÷ (Range maximum − Range minimum) × 100. In a band from $80,000 to $120,000, an employee paid $92,000 has a range penetration of 30%. That places them in the early part of the band. Many organizations use informal zones such as 0%–25% for entry, 25%–75% for fully proficient, and 75%–100% for expert or highly tenured employees.
These two measures tell different parts of the story. Compa-ratio shows how pay lines up with the market target. Range penetration shows how much room is left before the top of the band. Used together, they make pay decisions a lot easier, especially when budgets are tight and not everyone can get the same increase.
If an employee falls below the minimum, move them to at least the floor as soon as the budget allows. If someone is above the maximum, hold base pay flat and use lump-sum bonuses until the range catches up.
Document rules for raises, promotions, and market adjustments
Write the rules down before managers start making pay calls. That cuts down on guesswork and helps HR apply the same standards across teams.
For merit increases, set a budget and tie it to both performance and position in range. A common U.S. merit budget is about 3% of total base payroll. Increase levels often break out like this:
- 0%–1% for employees not meeting expectations
- 2%–3% for employees meeting expectations
- 3%–5% or more for employees who exceed expectations
Many employers also adjust merit increases based on where the employee sits in the band. For example, an "Exceeds" performer below 80% range penetration might get 5%–6%, while that same rating above 90% penetration might get 3%–4% or a lump sum instead.
Promotions should also follow clear rules. A small grade move often comes with an 8%–10% increase. A promotion with a much larger scope change may call for 12%–15%+. Before approving the increase, compare the employee's new pay against peers and direct reports already in that grade. Otherwise, you can create compression the moment the promotion goes through.
Market adjustments and equity corrections need their own rules. Set thresholds in advance. For instance, you might allow an off-cycle adjustment when an employee's compa-ratio drops below 0.80 even though performance is strong, or when market data shows a role's benchmark has moved by 8%–10% since the last review. Equity corrections often fall in the 3%–10% range, depending on how serious the gap is, and managers should provide market benchmarks, internal comparators, and current performance data for HR review.
CleverSlip can help with salary structure execution by keeping payslip history, employee self-service, and pay-change records in one place. That also makes later pay equity reviews and payroll updates easier.
Protect Compliance, Pay Equity, and Payroll Execution
Once pay grades and movement rules are in place, the last step is making sure the structure holds up under compliance review and works cleanly in payroll.
Align the structure with FLSA and pay transparency requirements
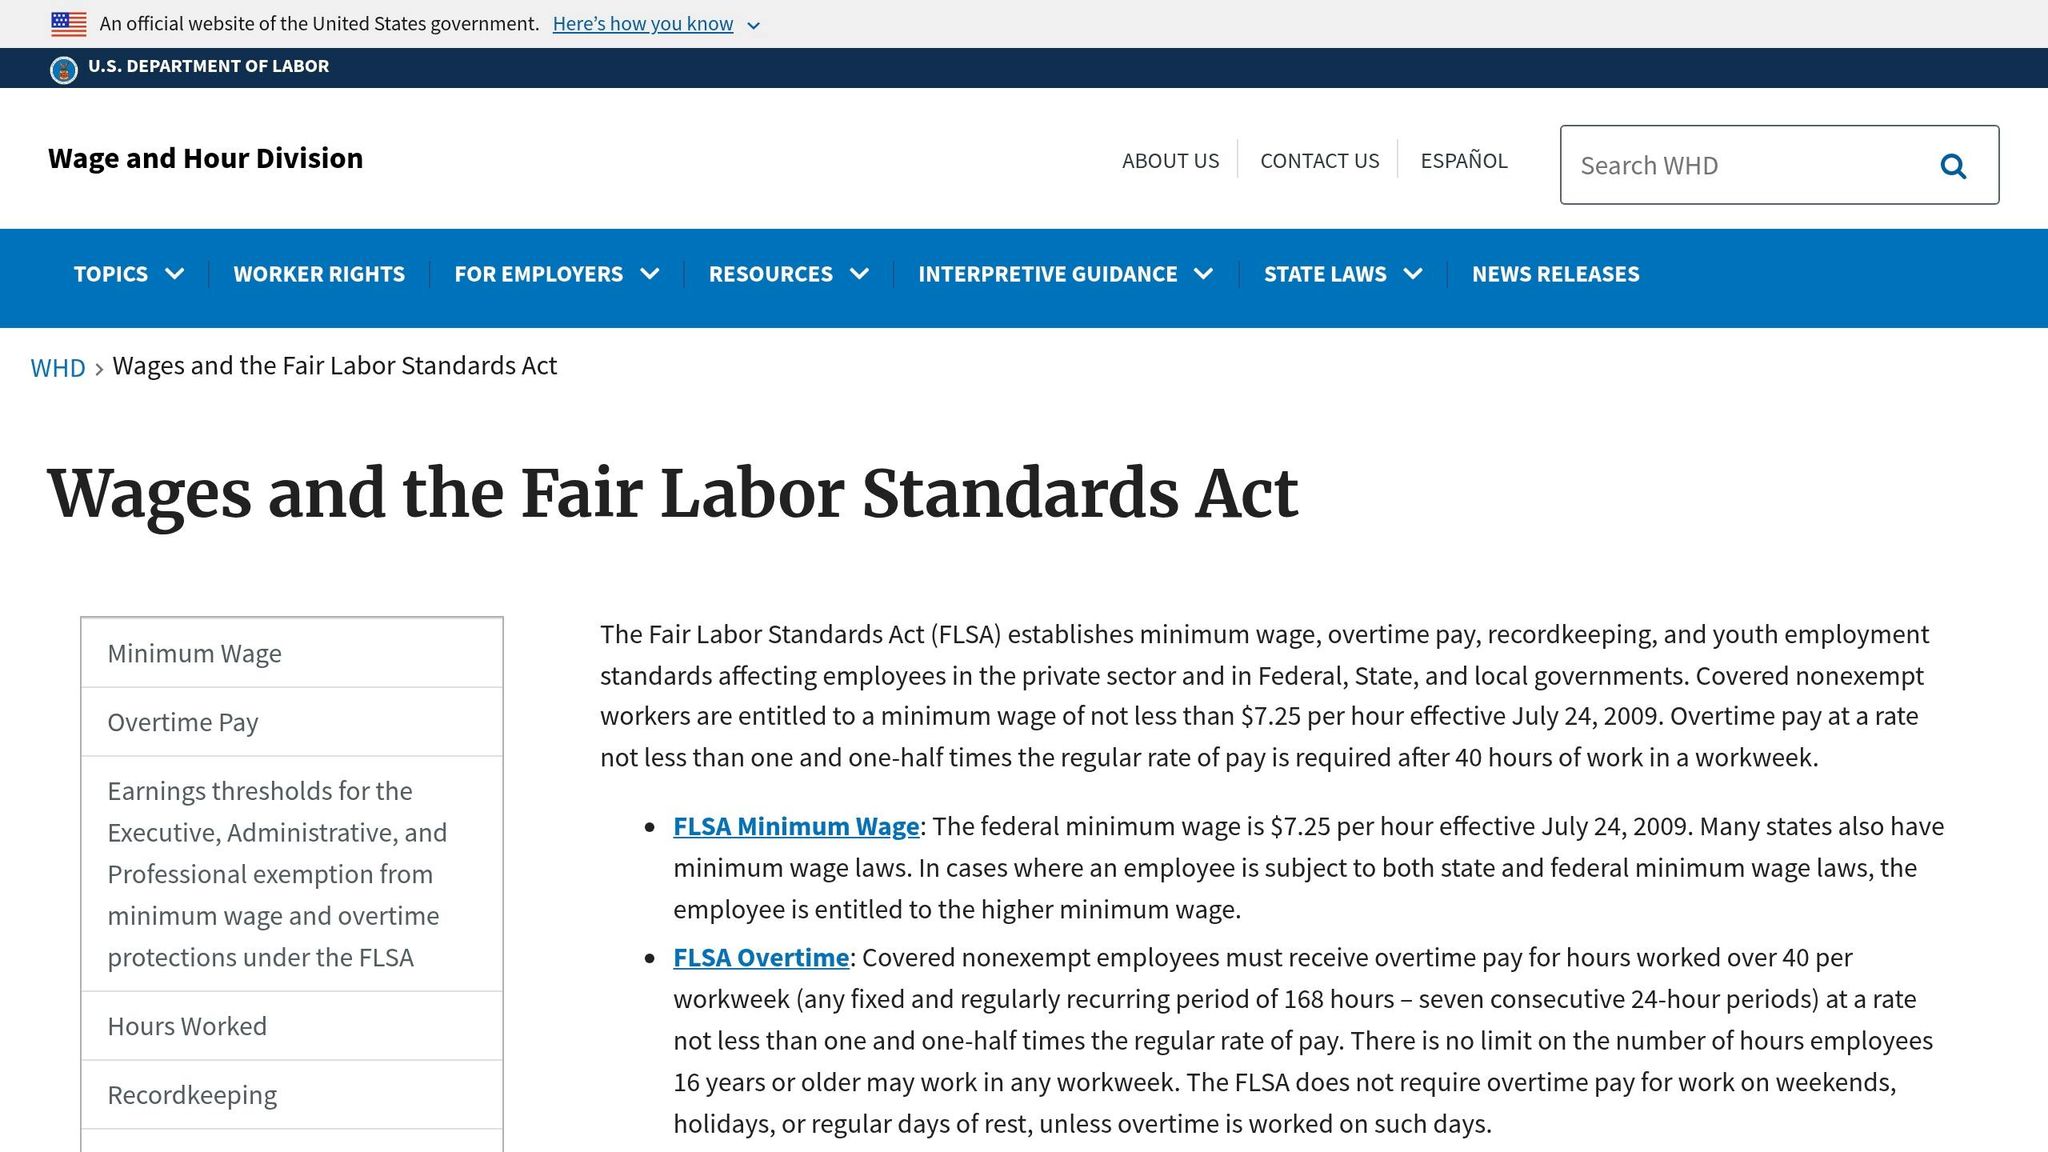
A salary structure only works if it can pass a compliance check. In plain English, your pay classifications need to match how the law treats exempt and nonexempt roles, and your posted pay ranges need to follow disclosure rules everywhere you hire.
Under the FLSA, an employee must be paid on a salary basis, meet the salary level threshold, and mainly perform exempt duties. For many white-collar exemptions, the current federal threshold is $684 per week ($35,568 annually). Paying someone a salary does not automatically make them exempt. And if a nonexempt employee is paid on a salary basis, that employee is still owed overtime for hours worked over 40 in a week.
That’s why it helps to build exempt and nonexempt logic right into the grade structure. Exempt-only grades should sit above the salary threshold. Nonexempt grades should be marked for overtime treatment from the start.
On the pay transparency side, the rules are mostly set at the state and local level, not the federal level. Many states and Washington, D.C. now require pay-range disclosure. The simplest way to stay on track is to keep one central range table by job and location, so job postings always pull from the approved range.
| Compliance Topic | Key Requirement | Salary Structure Decision | Practical Step |
|---|---|---|---|
| FLSA Exempt Status | Salary basis, salary level, and duties test | Exempt-only bands with minimums above the threshold | Lock exempt job titles to qualifying grades; review duties annually |
| FLSA Overtime (Nonexempt) | Overtime at 1.5× regular rate for hours over 40 | Nonexempt bands built on hourly rates and overtime eligibility | Tag nonexempt grades in payroll and calculate overtime correctly |
| State Pay Transparency | Disclose salary ranges in postings or upon request | Documented band minimums and maximums by job and location | Require job postings to pull ranges from the central band table |
Run pay equity reviews and correct unjustified gaps
After compliance checks, the next job is testing whether the structure still leads to pay differences you can explain.
Most teams do pay equity reviews on a regular cycle, often alongside annual compensation planning. Start by grouping employees into comparable cohorts based on the job families and levels you defined earlier, within the same location. Then look at base pay, bonuses, and other cash pay together, not one piece at a time.
Inside each cohort, test whether pay differences line up with legitimate factors like:
- Job level
- Documented performance ratings
- Tenure tied to the role
- Location-based market rates
After adjustments, unexplained gaps above 5% should be investigated.
If those gaps remain, document the remediation plan in writing before making any pay changes. Spell out the affected employee, the adjustment amount, the effective date, the approving manager, and the budget source. That paper trail matters. It helps later reviewers tell the difference between an equity correction and a normal merit increase.
When possible, schedule corrections during the normal compensation cycle. If the gap is material or creates legal risk, make the change out of cycle.
Use payroll systems to maintain structure accuracy
After equity reviews, payroll systems are what keep the structure accurate as changes move through the company.
A salary structure managed only in spreadsheets is hard to police and even harder to audit. Payroll and HR systems make the structure usable day to day by storing grades, bands, salary history, effective dates, approvals, and the reason behind each pay change in one place.
Set the system up to stop salaries below band minimums for exempt roles and flag entries above the maximum before they go through payroll. That kind of guardrail saves a lot of cleanup later. It also helps to connect your HRIS, payroll, and performance systems so each employee has one trusted record.
CleverSlip can generate PDF payslips, store pay history, and keep pay-change records tied to the underlying salary structure.
Conclusion: How to Keep a Salary Structure Useful Over Time
Once grades, bands, and movement rules are set, the job becomes upkeep. A salary structure can't sit on a shelf while the market, your roles, and your business shift around it. Most companies with formal pay structures review their pay ranges at least once a year, and do a deeper market study every 3–5 years.
Skip that yearly review and the cracks start to show. Midpoints drift below the market, compa-ratios slip, and pay compression gets worse. It also helps to set clear triggers for off-cycle changes. Reorganizations, acquisitions, new job families, or sharp labor-market changes are all moments when pay structures can drift if no one steps in.
This only works when leadership, HR, and payroll share the load.
Key takeaways for business owners, HR, and payroll teams
Each team has a direct part to play in keeping the structure working day to day.
Business owners and executives decide the compensation philosophy and sign off on major changes to the structure. That philosophy includes your target market position, your pay-for-performance approach, and your pay equity commitments. It should be reviewed at least once a year to make sure it still matches your business plan and budget. For example, if your company starts focusing on keeping senior technical talent, that change shouldn't stay at the strategy level. It should show up in the pay bands for those roles.
HR and compensation teams handle the day-to-day system work. That includes checking bands against current U.S. market data, calculating compa-ratio and range penetration for each employee, running pay equity reviews, and guiding managers on offers and promotions.
Payroll teams put the structure into action. Every approved raise, promotion, or market adjustment needs to be coded the right way, time-stamped, and tied to the correct grade and band. Payroll teams also keep pay changes coded correctly and maintain payslip history; CleverSlip can centralize payslip generation, delivery, and history tracking. Good records make the structure easier to defend.
Put the philosophy, rules, and exceptions in one system, and review them on a set schedule.
FAQs
How do I choose between grades, bands, and broadbanding?
Choose grades to group roles by level so pay progression stays consistent across similar jobs.
Choose salary bands when you need a pay range inside each grade, while keeping big pay gaps under control.
Choose broadbanding when you want fewer, wider pay ranges and more flexibility. This setup often works best for mid- to senior-level roles, as long as you back it up with clear internal criteria.
What salary range spread should I use for each job level?
The sources reviewed do not suggest a salary range spread by job level.
Instead, they focus on how pay is calculated and shown, such as:
- dividing annual salary by pay periods
- basic payslip rules
- withholding compliance basics
So for this part of CleverSlip’s salary structure design guide, you’ll need guidance from sources beyond the ones reviewed.
When should I update my salary structure?
Update your salary structure when tax rates or withholding rules change, when mid-period changes affect salary, benefits, tax status, or garnishments, and after regulatory updates that affect payroll calculations.
If you miss those updates, payslips and year-to-date totals can drift out of line. That opens the door to compliance risk.
Payroll, simplified
Create structured payslip PDFs in minutes.
Build country-specific payslip documents, deliver them instantly, and keep a searchable history for audits and employee requests.
Start free